Drone connectivity 3D visualization and analytics app to enable safe drone operations
Web app for safe beyond-visual-line-of-sight drone operations: 3D visualization and analytics that predict cellular-network connectivity parameters.

Overview
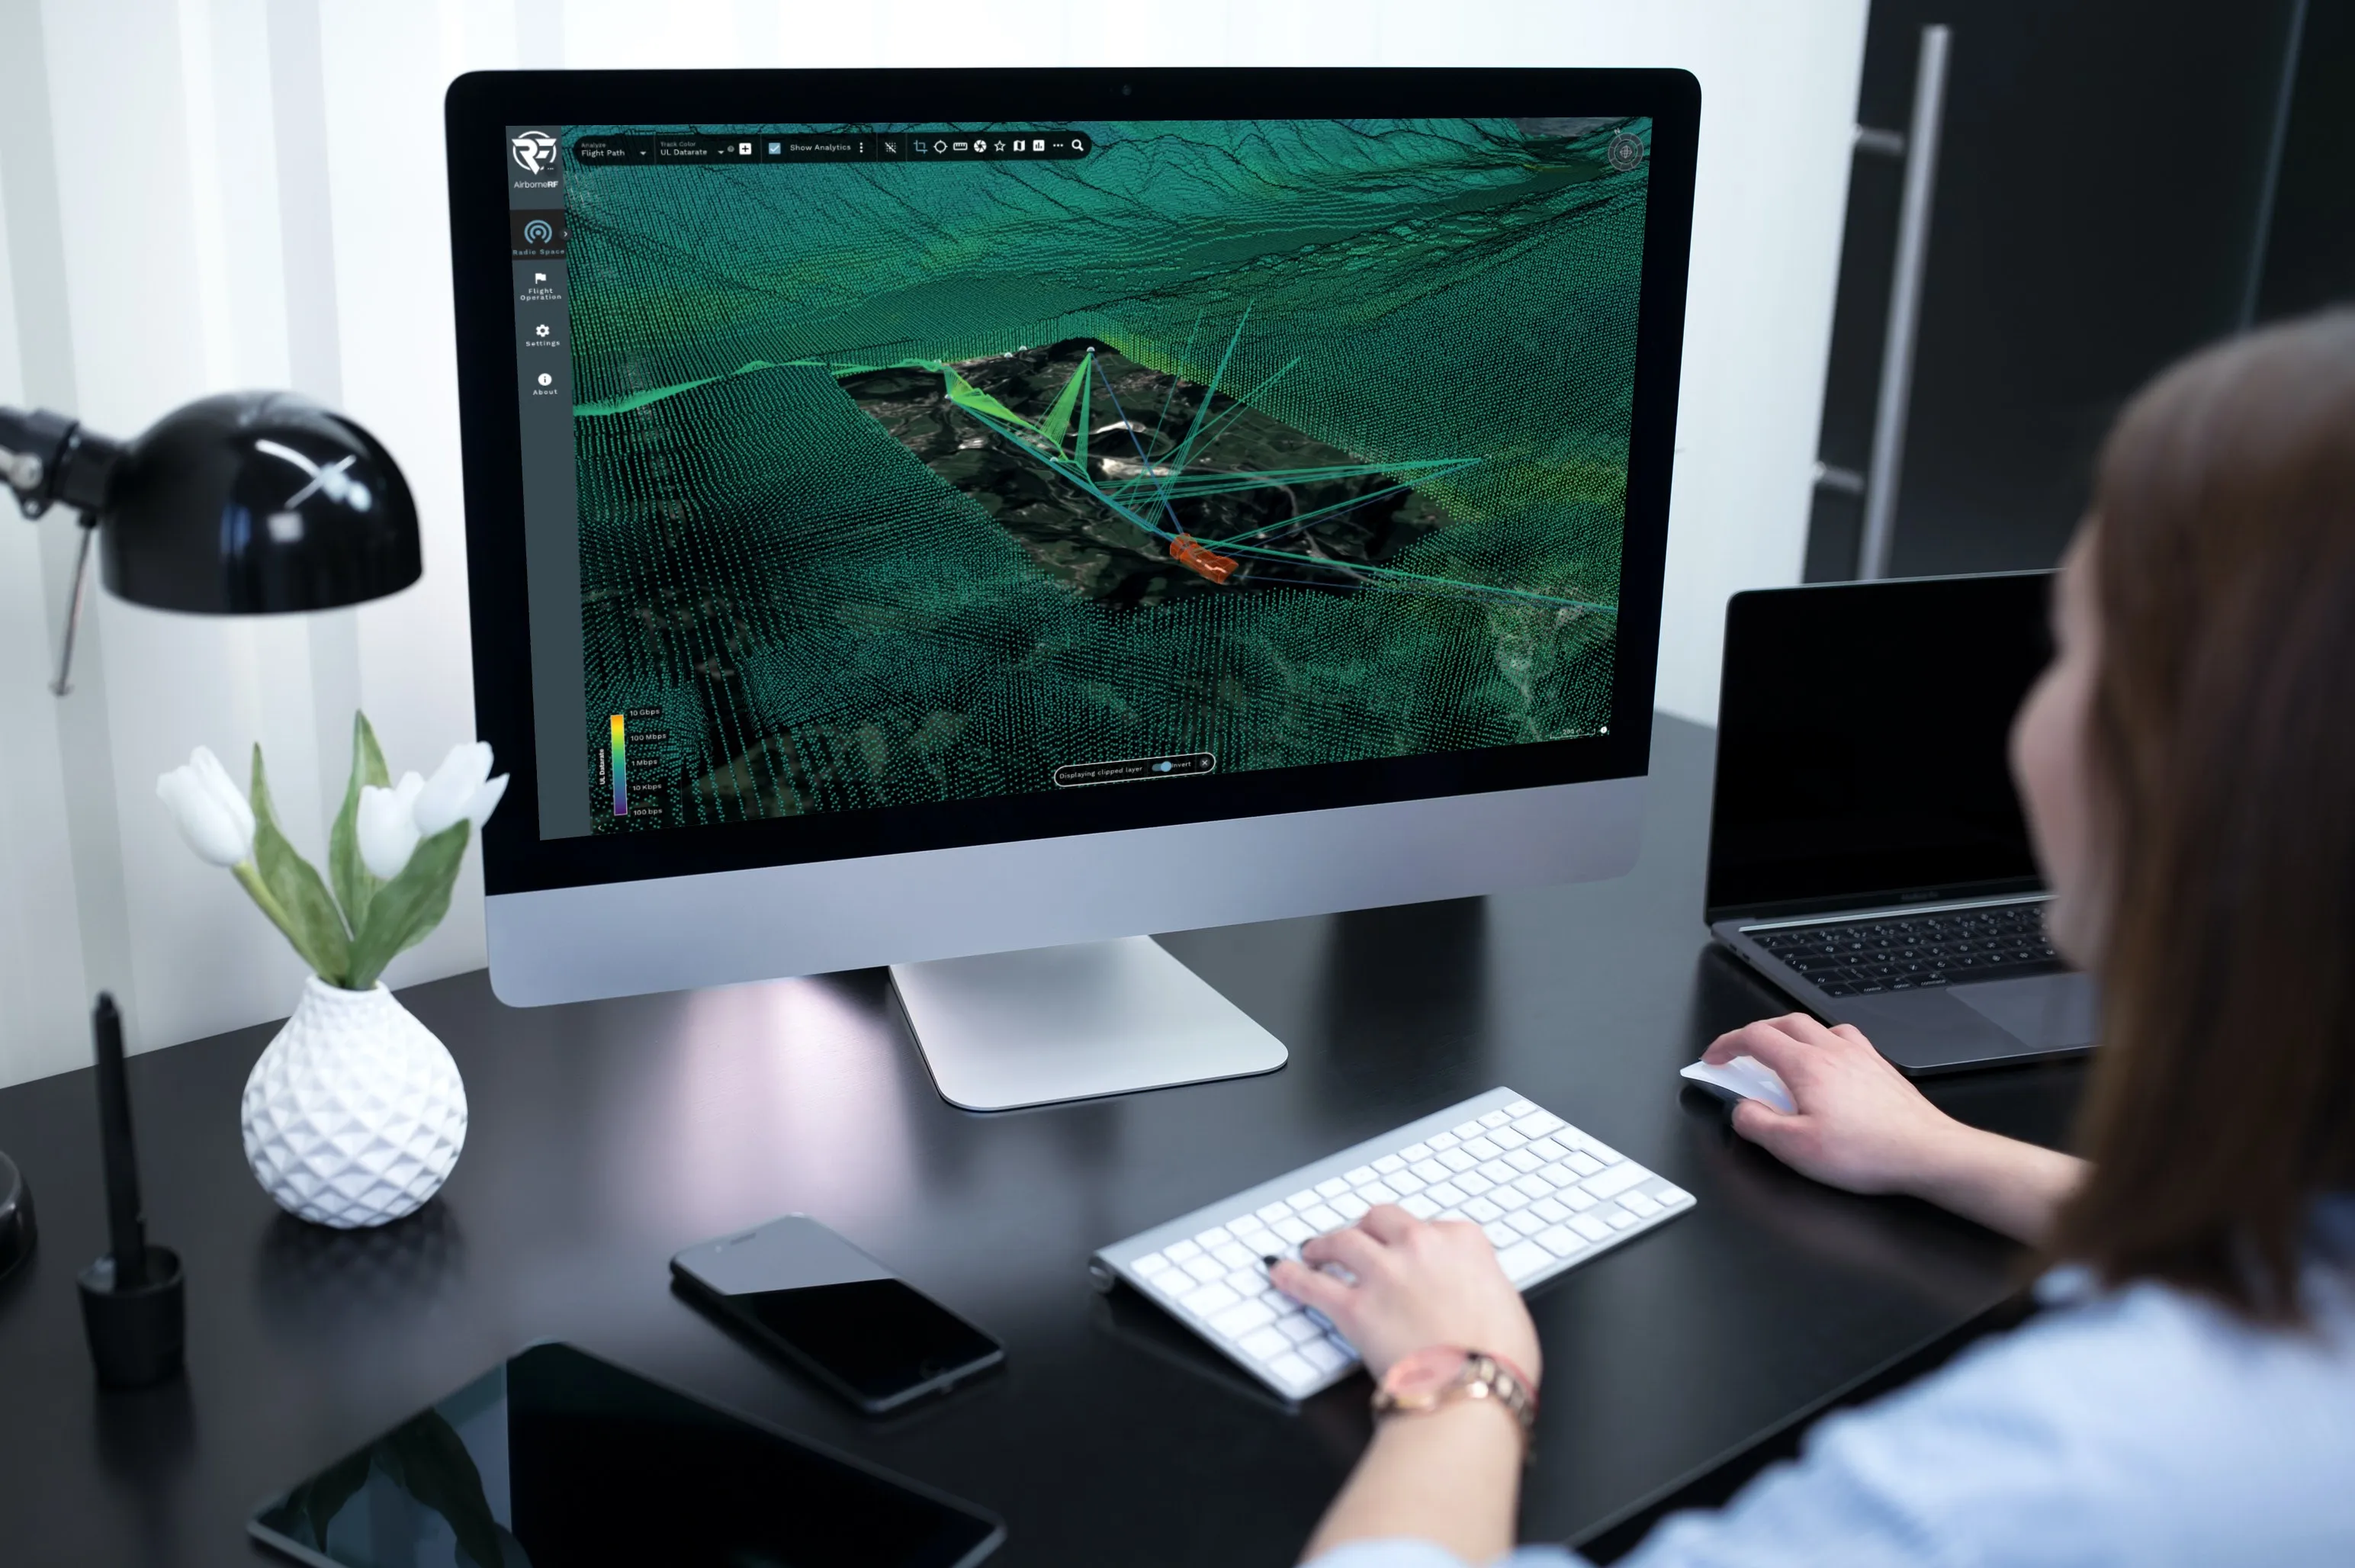
This web application, built around 3D visualization and analytics, enables safe beyond-visual-line-of-sight (BVLOS) drone operations on cellular networks. Reliable cellular connections are the foundation of future drone operations; connection parameters are predicted using a radio-frequency model that draws on mobile-network cell database information.
My role
I owned the interface end to end: interaction design, visual design, and the frontend implementation in Angular and CesiumJS. Leading the engineering team and working in it, I translated prediction outputs into something operators could reason about, and defined how the application exposed the underlying model without hiding its uncertainty.
As Director of Engineering I was responsible for that team of six, for the web application, and for its operation on Kubernetes and Linux. Beyond the frontend I contributed to large parts of the backend in Java and Python. The core RF algorithms were developed by the team in C++, on an existing architecture that I extended and maintained, including the interfaces between that layer and the application.
Features
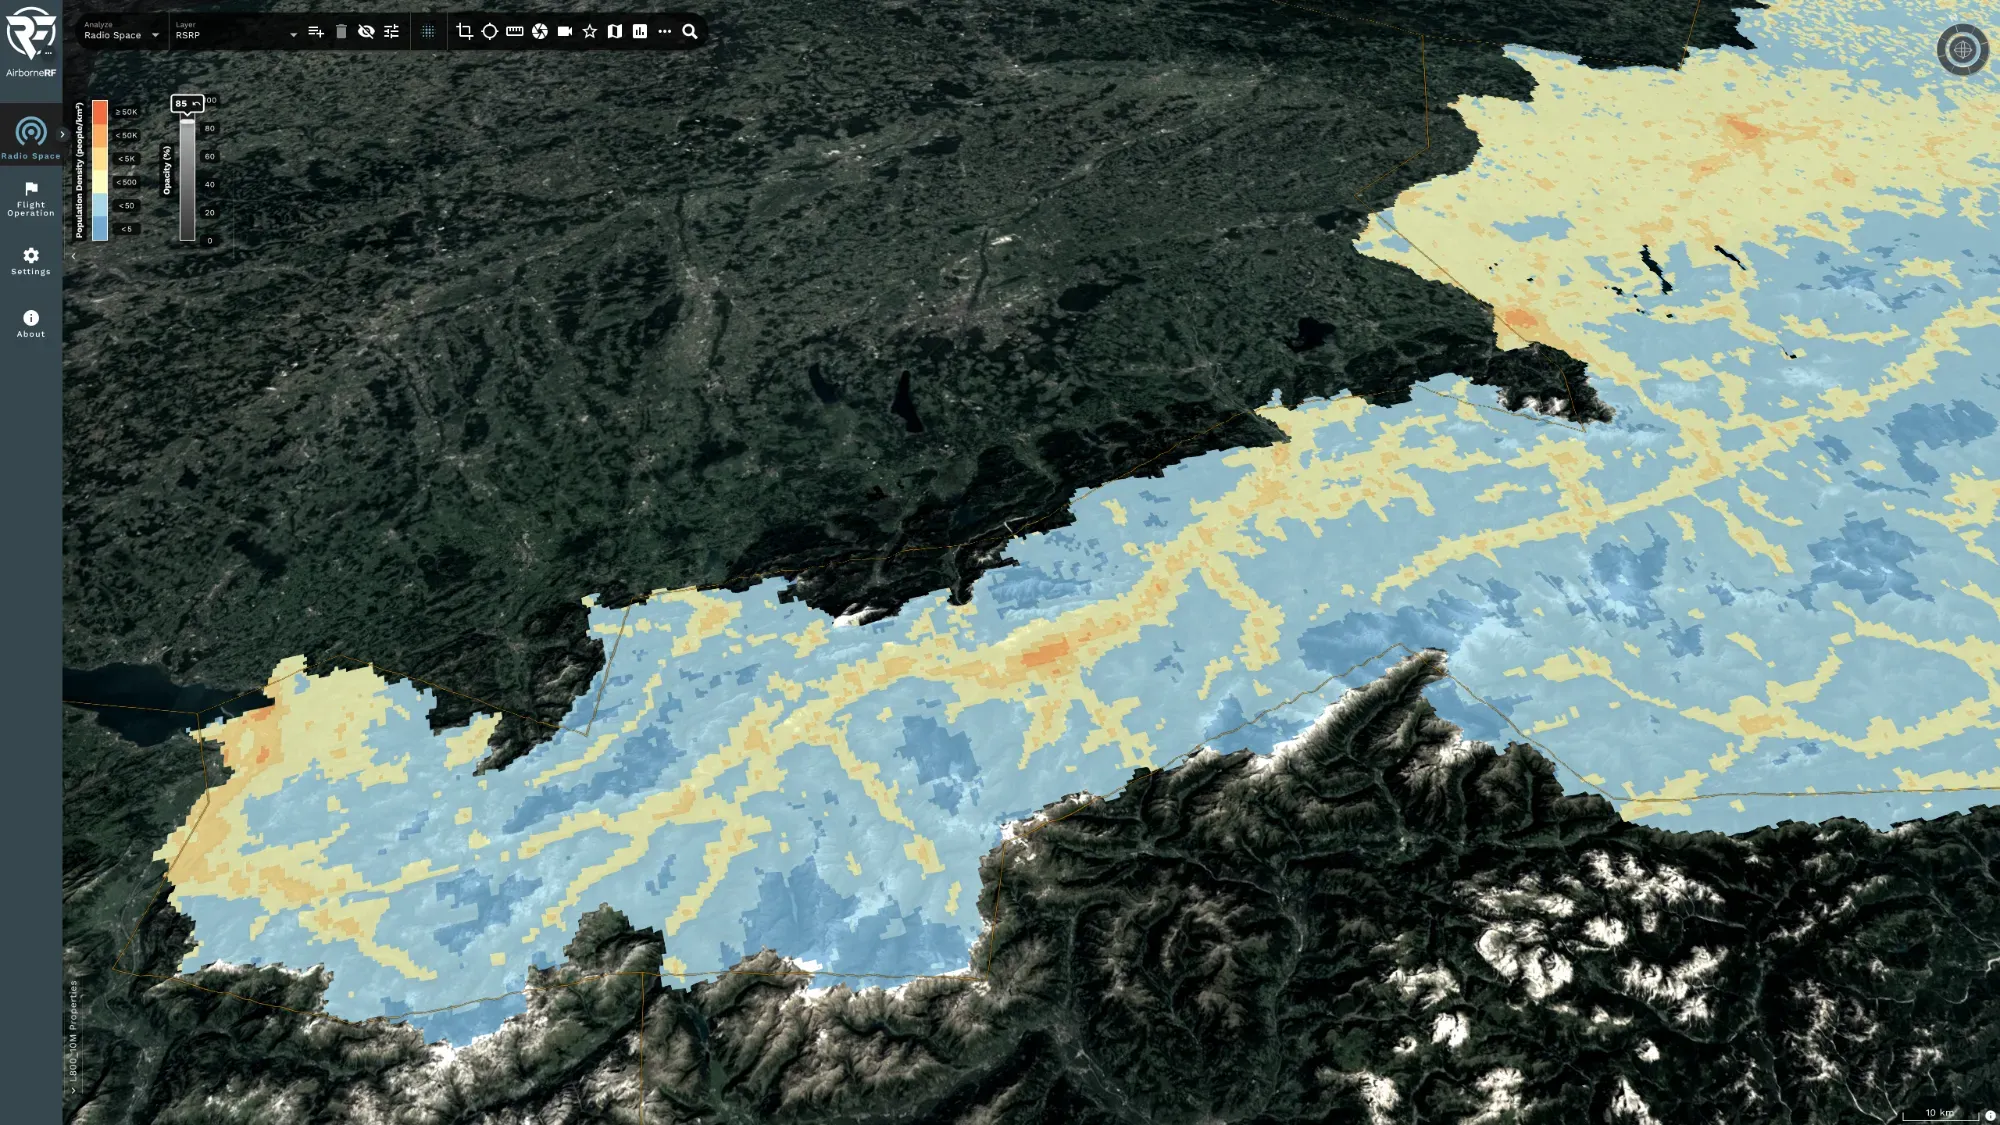
A GIS-inspired tool where operators explore a 3D Earth representation and interact with prediction outputs:
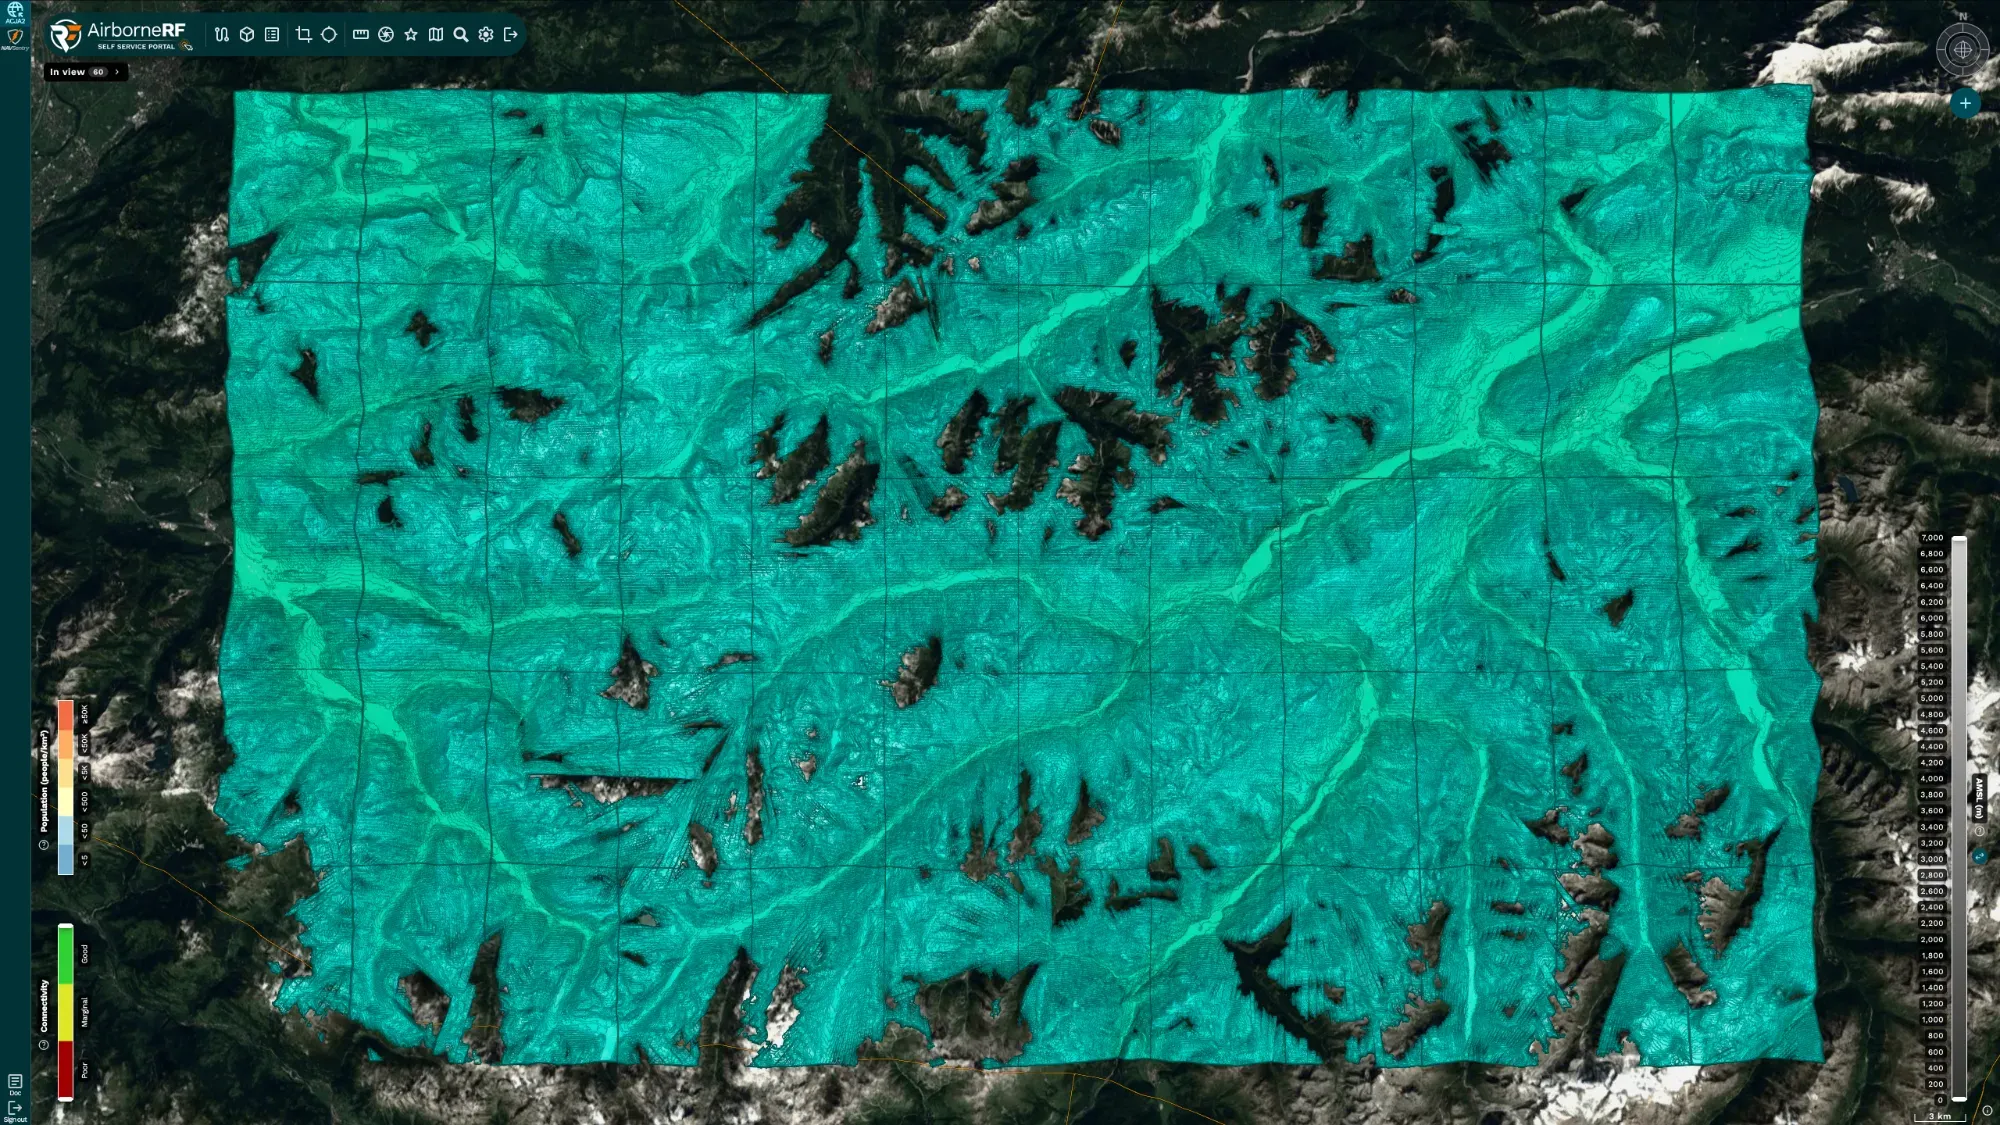
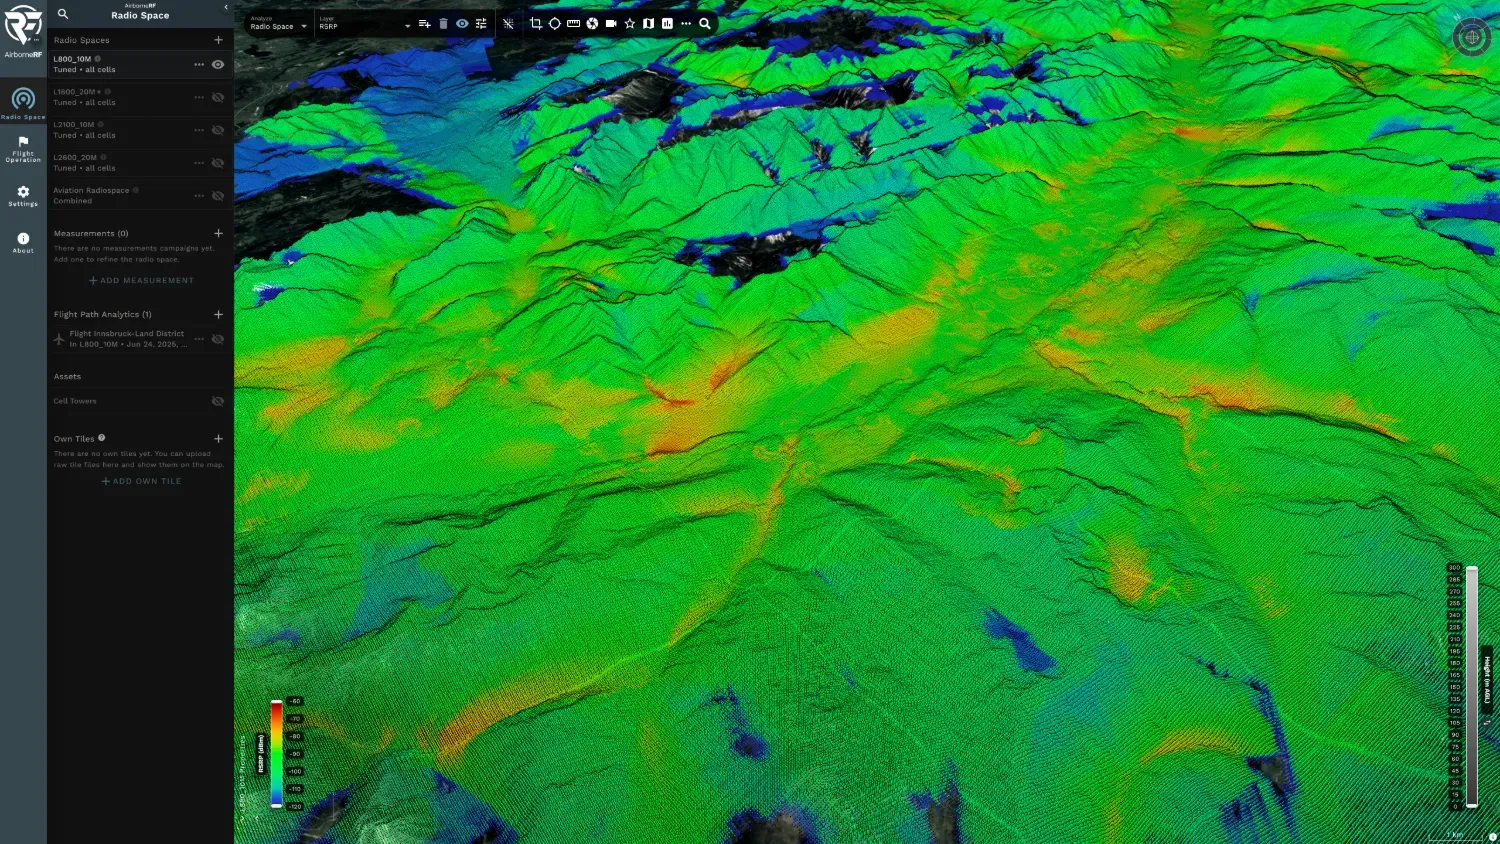
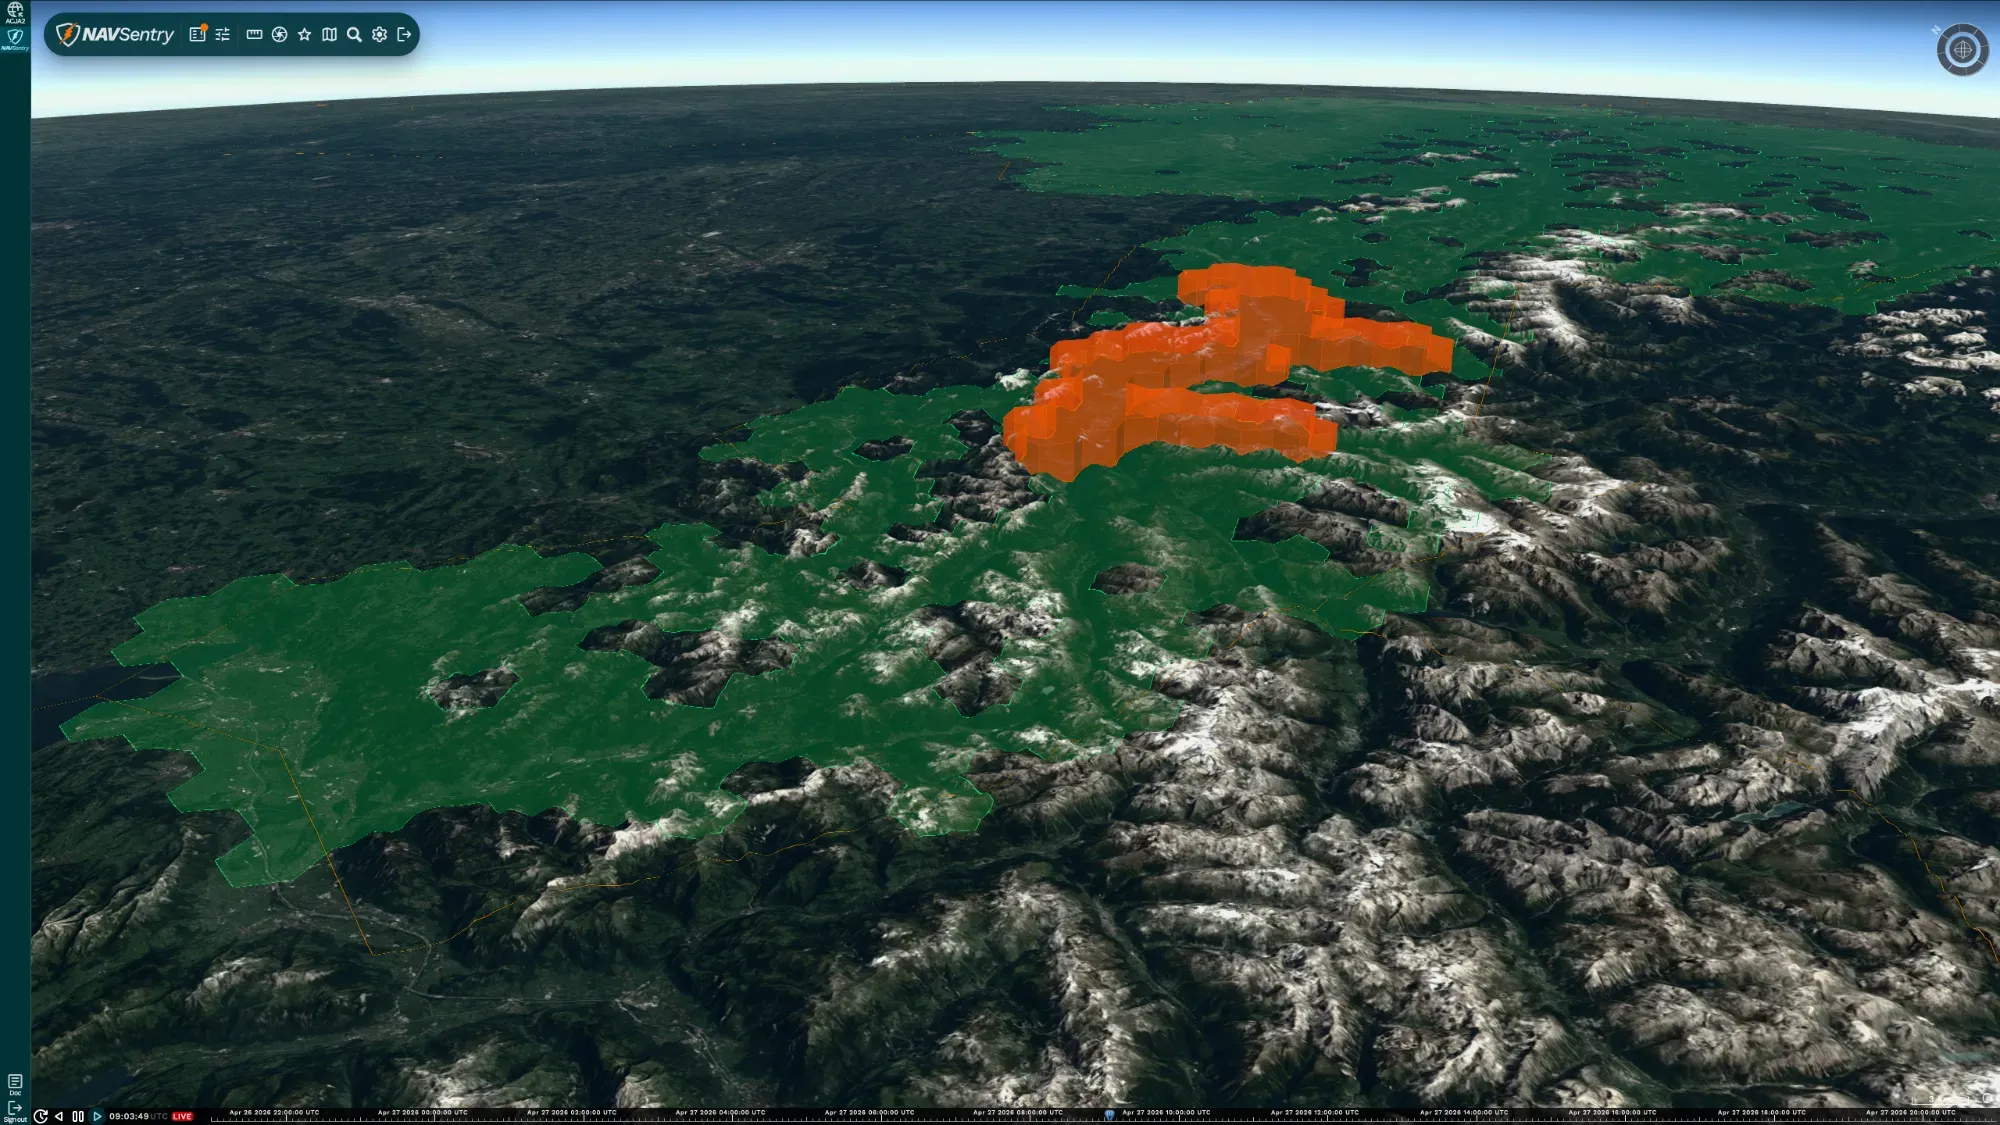
- Render point clouds and volumetric geometries of network indicators (signal strength, interference) and aggregated regions from a rule engine
- Monitor GNSS reception health and flag areas of degraded signal
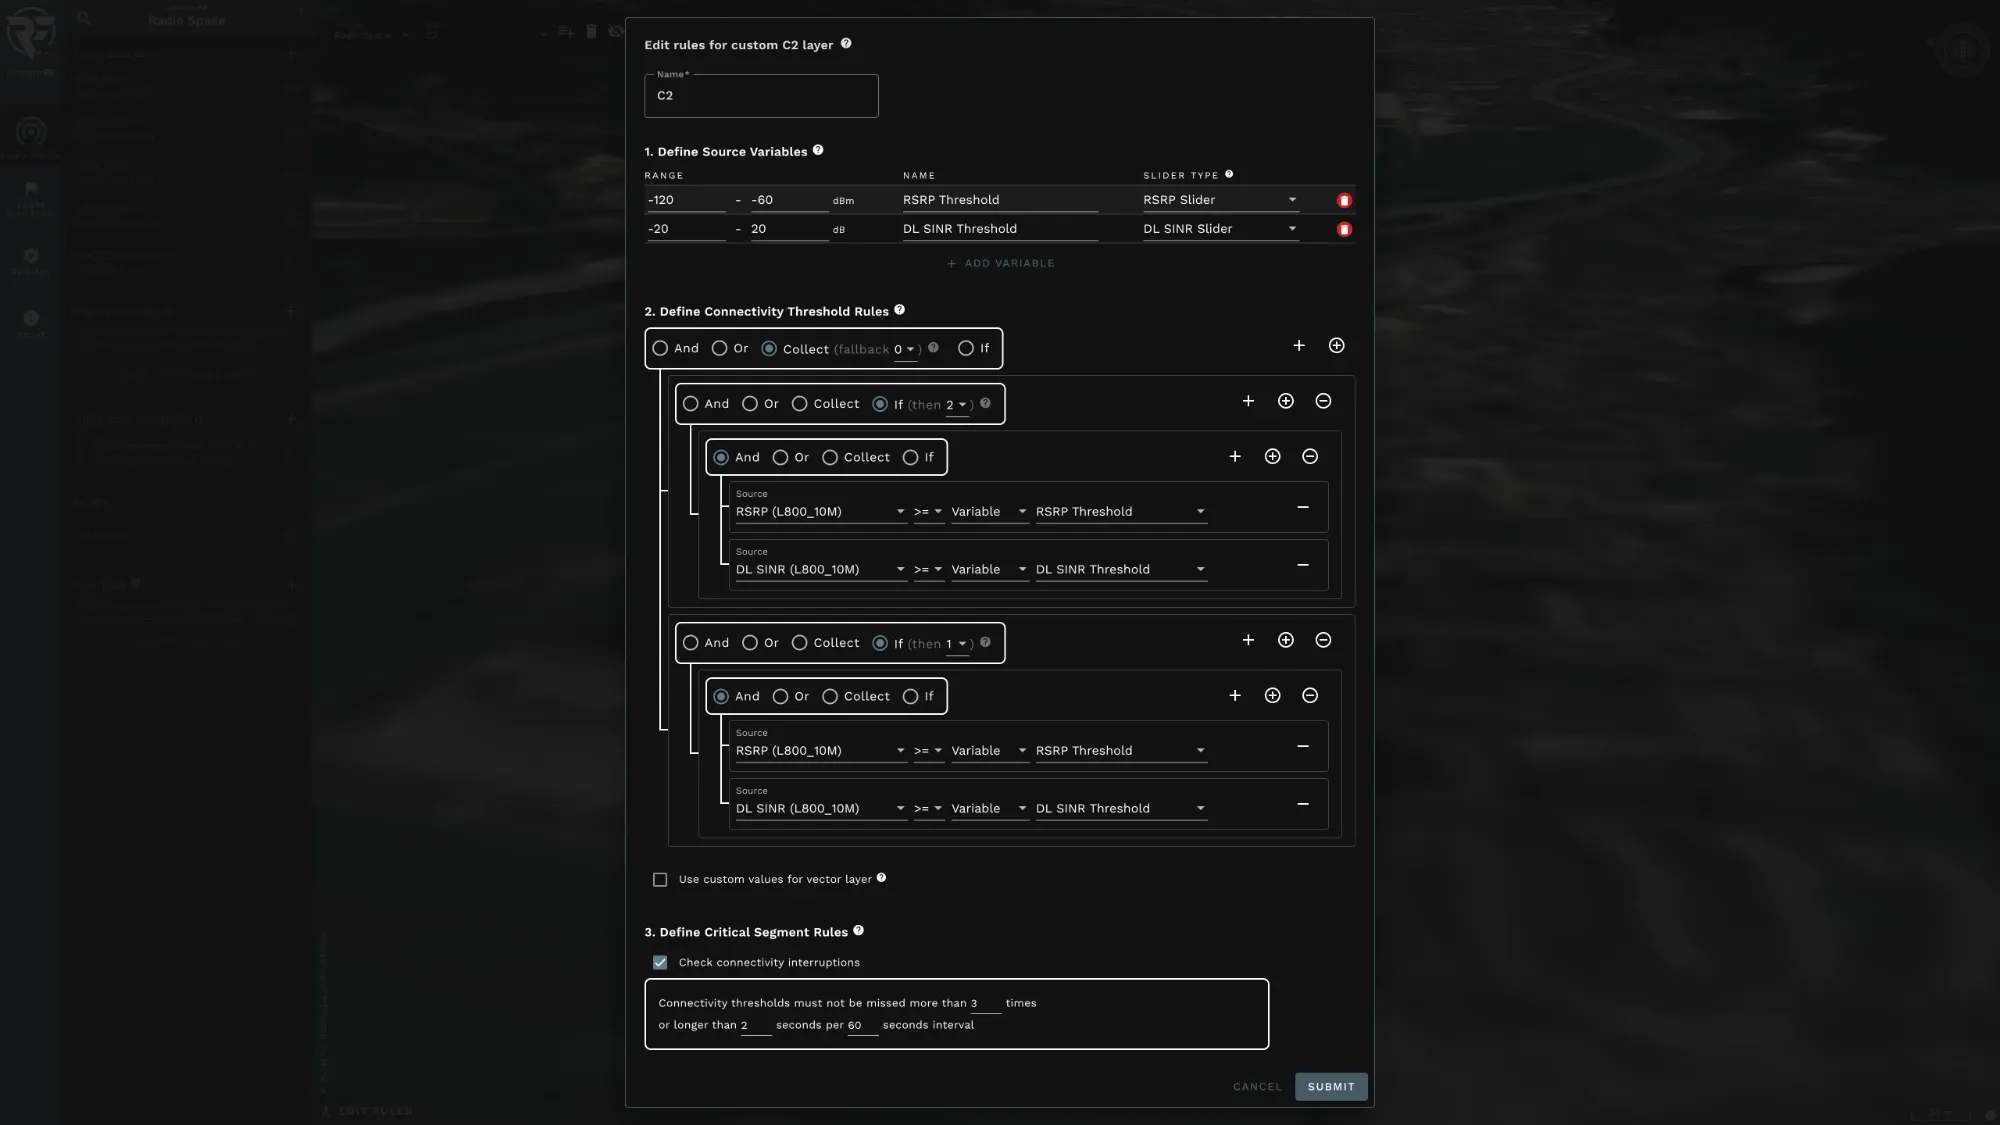
- Freely define rules that determine safe flight parameters with minimum signal and maximum interference requirements
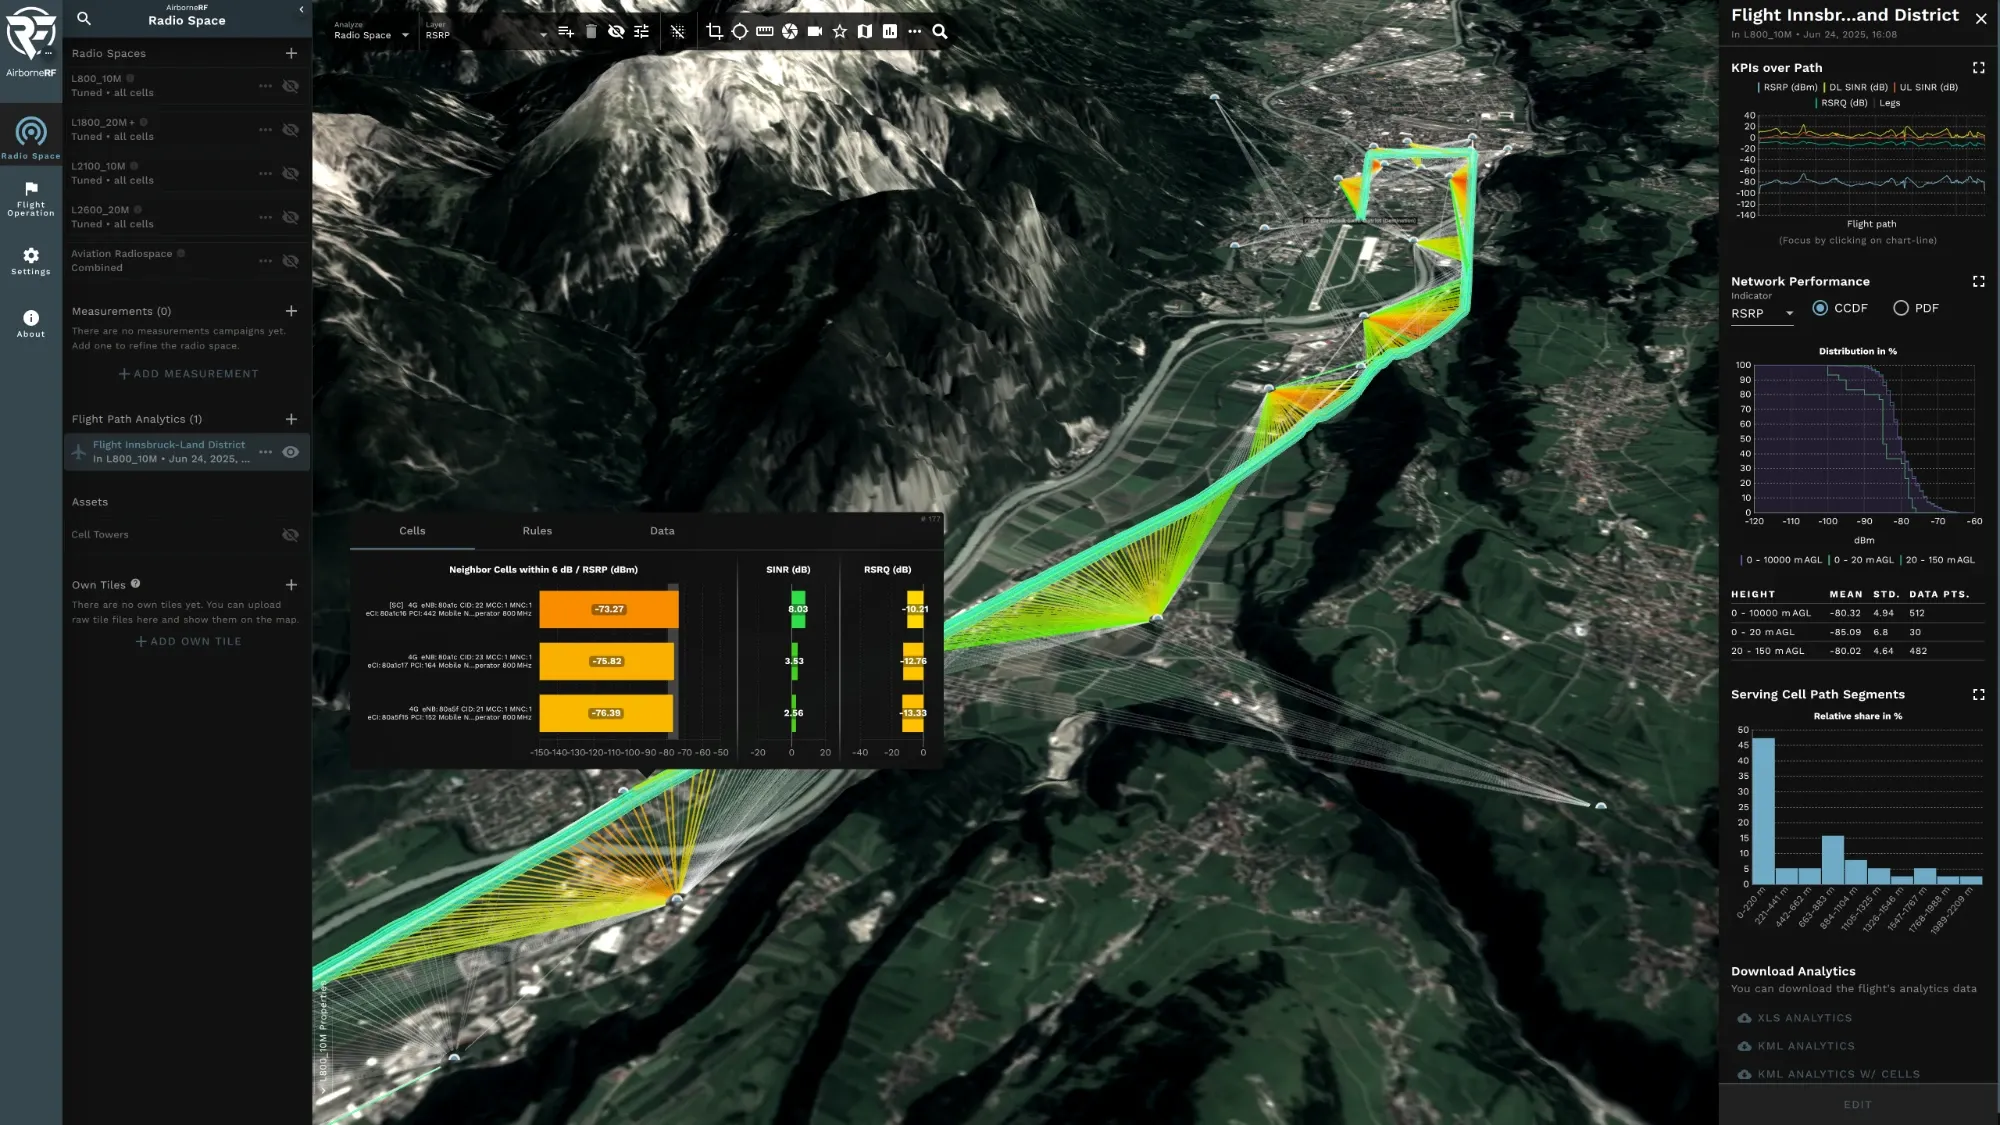
- Analyze and visualize real-world measurement flights
- Plan and perform simulated flights on mobile networks
- Visualize flight-path analytics: safe corridors, serving cell connections, neighbor cells
Process
Development ran in sprints, with direction aligned between business development, the product owner, and engineering, so that what was committed to customers and what we could build stayed in step. Much of the roadmap came directly from customer feature requests, and a large share of the work went into keeping a deployed product running: support, maintenance, bugfixing, and debugging off-site, since the platform was hosted in customer infrastructure rather than our own.
That constraint turned out to be formative. Diagnosing behavior in an environment we could not inspect directly meant the application had to make its own state visible, and the same discipline shaped the user-facing side of the product.
Challenges
Making a probabilistic model legible. Predicted signal coverage is not a fact but a probability with a margin of error. Presenting it as a solid volume invites false confidence; presenting the uncertainty in full makes the interface unusable. Instead of resolving this in the visualization alone, we gave operators ways to interrogate the model: editable rules, side-by-side comparison of scenarios, replaying real measurement flights against the corresponding predictions, and vertical slicing and clipping of the 3D point clouds to inspect a specific altitude band rather than a solid mass.
Rendering volumetric network data at usable framerates. Coverage predictions could be run for any region in the world, and the resulting datasets are far more than a browser can request or draw at once. We loaded only what the viewport actually needed, cached it client-side, and fetched further data dynamically as operators moved through the scene, so that exploration stayed continuous instead of stopping at every camera change.
A rule engine non-programmers can operate. Operators needed to define their own safety thresholds, with nested conditions and limits on how long a connection may be interrupted, without writing code. Conversations with customers supplied the domain knowledge, each one adding a piece we did not have at the start. The form the interface finally took came out of a design session built on that accumulated understanding.
Impact
Direct feedback on the RF prediction process and the data-exploration capabilities proved essential for understanding outcomes and spotting opportunities. The analytics + 3D visualization combination landed well with industry clients.
Related work
Companion projects for this client included the platform's company website and a landing page with branding for the drone-connectivity platform.